

Will Hong Kong 50 Index have enough momentum to break support?
Hong Kong 50 Index is heading towards the support line of a Falling Wedge and could reach this point within the next 13 hours. It has tested this line numerous times in the past, and this time could be no different from the past, ending in a rebound instead of a breakout. If the breakout […]
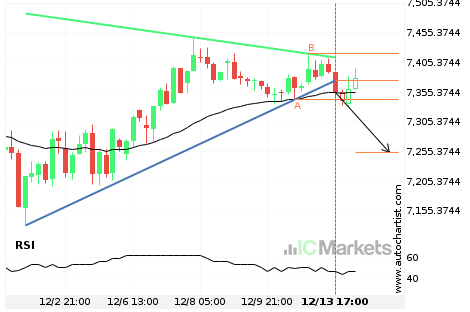
Support line breached by Australia 200 Index
Australia 200 Index has broken through the support line which it has tested twice in the past. We have seen it retrace from this line before, so one should wait for confirmation of the breakout before trading. If this new trend persists, a target level of around 7253.0870 may materialize within the next 2 days.

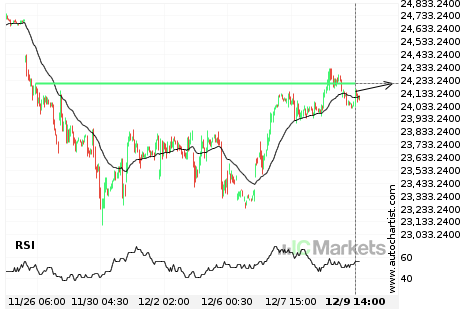
Should we expect a bearish trend on Hong Kong 50 Index?
The breakout of Hong Kong 50 Index through the 23898.4004 price line is a breach of an important psychological price that is has tested numerous in the past. If this breakout persists, Hong Kong 50 Index could test 23501.5391 within the next 2 days. One should always be cautious before placing a trade, wait for […]

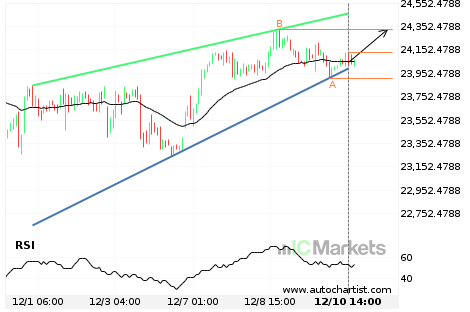
Australia 200 Index approaching resistance of a Rising Wedge
Australia 200 Index is approaching the resistance line of a Rising Wedge. It has touched this line numerous times in the last 18 days. If it tests this line again, it should do so in the next 2 days.

Will Hong Kong 50 Index have enough momentum to break resistance?
Hong Kong 50 Index is heading towards the resistance line of a Rising Wedge and could reach this point within the next 2 days. It has tested this line numerous times in the past, and this time could be no different from the past, ending in a rebound instead of a breakout. If the breakout […]

Breach of important price line imminent by Australia 200 Index
Australia 200 Index is moving towards a line of 7334.4102 which it has tested numerous times in the past. We have seen it retrace from this position in the past, so at this stage it isn’t clear whether it will breach this price or rebound as it did before. If Australia 200 Index continues in […]

Should we expect a breakout or a rebound on Hong Kong 50 Index?
The movement of Hong Kong 50 Index towards 24204.6992 price line is yet another test of the line it reached numerous times in the past. We could expect this test to happen in the next 2 days, but it is uncertain whether it will result in a breakout through this line, or simply rebound back […]